
When assessing investment opportunities, the return on investment is just one part of the equation. Another equally important aspect is the risk. In our 'Understanding Risk' series, we discussed various types of risk that the average business is exposed to: macro, industry, and company-level risk.
You can read the series in full here. However, to understand the following, all you need to know is that the risk of any investments comes down to one thing: uncertainty.
Of course, uncertainty is—by definition—a fairly abstract concept. How much uncertainty is a lot of uncertainty? And how do we even measure uncertainty? That’s where volatility comes in.
Why the average is only half the story
Before we explain what volatility is, let’s take a step back and define what the opposite of risk is: certainty.
In statistics, the average represents certainty. If an investment always yields the same average return, then you can say that it has complete certainty. You know what to expect, and there is no risk.
But investments rarely behave that way. Returns fluctuate, sometimes wildly, and it's this variability we quantify using volatility, measured as standard deviation. Standard deviation tells us how far individual outcomes tend to stray from the average over time—the wider the spread, the greater the uncertainty, and therefore the higher the perceived risk.
In mathematical terms, this is expressed as follows:

The above example is for a stock price. This measure essentially states that if the average stock price is "u," we can expect the stock price to deviate from "u" on any given day.
Volatility – A Visual Representation
For a more simplified illustration, consider the two illustrations below. Each represents a series of data points. We'll assume that each square's number represents that square's area (or size).
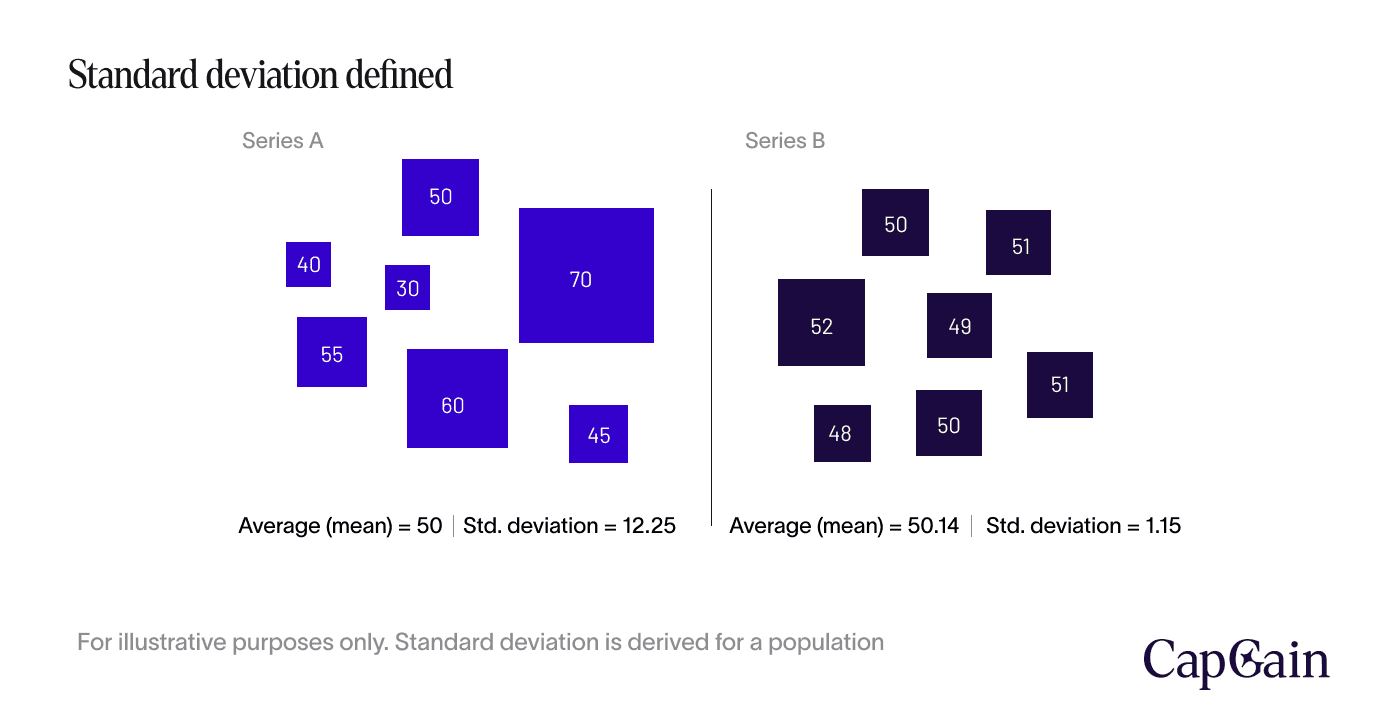
There are seven squares in each, and the two data sets have approximately the same average: 50 for series A and 50.14 for series B. That is, the average square size is the same. However, as you can see, the individual squares in Series A have greater variation—i.e., standard deviation—from the mean than in Series B.
Let’s imagine we have a dataset with returns spanning over a given period, say three years. The average gives us, well, the average. The standard deviation offers an indication of how far, on average, those returns deviate from that average (on average). Hence, a large standard deviation implies that each of our returns differs significantly from the average, on average.
In financial investments, the standard deviation becomes a key measure for portfolio construction for several reasons, which we will explore below.
Degree of uncertainty: Risk assessment and management
Before we proceed, it's essential to note that these estimates are based on our past observations and, therefore, do not guarantee future results. Still, the standard deviation provides us with a way to temper our expectations—and understand the trade-off between risk and return.
A higher standard deviation signifies higher volatility and, thus, greater uncertainty and risk. In contrast, a lower standard deviation indicates more stable and predictable performance.
Let's use venture capital and private credit to illustrate using the risk-return chart from Preqin Global Venture Capital Report 2022 ¹ .
Venture capital investments are often considered "high risk, high reward." Due to the nature of these investments, the potential returns can be substantial, sometimes with net returns in the three-digit range.
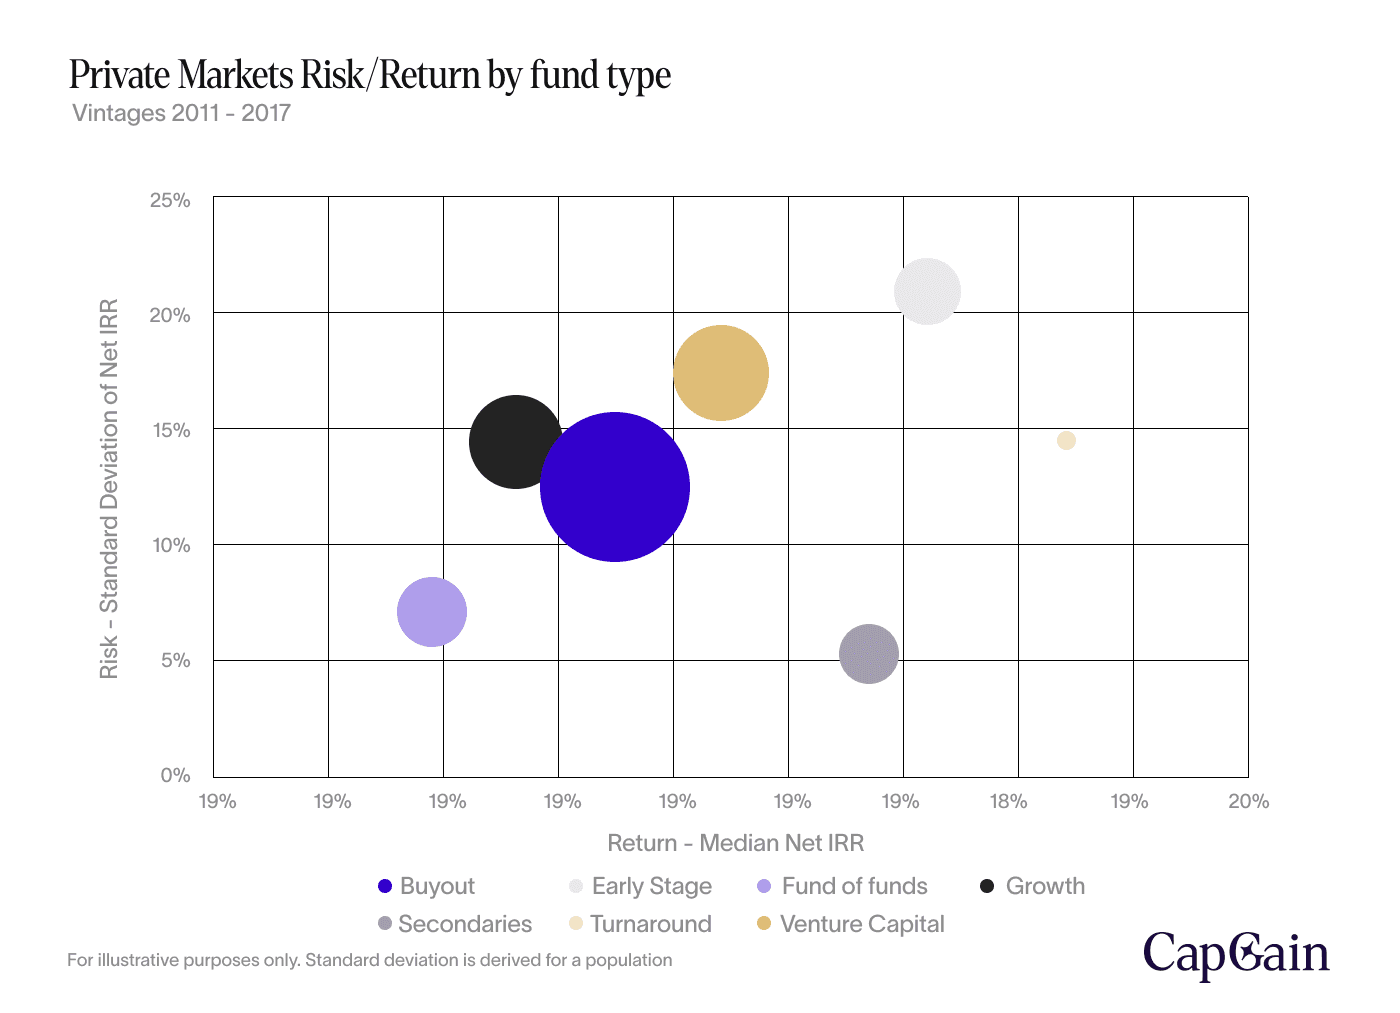
However, the risk is equally high, especially for early-stage investments. The reason is that venture capital invests in start-ups and early-stage companies. These companies have high – or even exponential–growth potential but also, by virtue of being start-ups, a high likelihood of failing.
Private credit, on the other hand, has a more modest risk-return profile. While returns are favourable to other fixed-income investments such as bonds, they'll rarely yield returns in the three-digit range.
Instead, it offers predictable repayment schedules and low default rates. This is again due to the nature of the underlying investments. Private credit provides financing solutions to companies with established business models and stable cash flows. Hence, the standard deviation - or variation - of the returns is lower.
Did you know: Google’s equity funding yielded one of the highest returns ever recorded
Sequoia Capital and Kleiner Perkins’s investment in Google is considered one of the most impactful venture capital investments in history, yielding an extraordinary absolute dollar return. Sequoia Capital and Kleiner Perkins co-led the initial venture funding round for Google in June 1999, each investing USD 12.5 million for a 10% stake in the company.
When the company IPO’ed in August 2004, the investors’ combined stake was valued at approximately USD 3.82 billion (based on an IPO price of USD 85 per share)
By mid-2005, less than a year after Google's highly anticipated Initial Public Offering (IPO), Kleiner Perkins' stake had generated an approximate total value of USD 4.3 billion. This remarkable outcome translated into an astounding return multiple of 344 times their initial capital outlay.
Note: Some estimates suggest the total realised value could reach USD 4.5 billion or more, which would represent a 360 times return.
Source: Burnam’s Beat June 2005 ² , The Next Web ³
Compound is the eighth wonder of the world
Standard deviation is important for assessing the expected return at any given point in time. It also plays an equally crucial role in analysing returns over time.
To grasp why this matters, consider a famous quote often attributed to Albert Einstein: “Compound interest is the eighth wonder of the world. He who understands it, earns it. He who doesn’t, pays it.”
Compounding is for the long-term growth of investments. It allows for wealth accumulation over time as the returns on your investments generate their returns in addition to the return gained from the initial investment. You’re getting a return on your return, so to say. This effect can transform modest initial contributions into substantial sums over periods of decades.
The compounding of returns is greatly influenced by not just the average return, but also the variability of those returns. While average returns are important, the variability of those returns—captured by volatility—can significantly erode long-term growth. In short, the more uneven the returns, the less efficient the compounding.
Example: The long-term implication
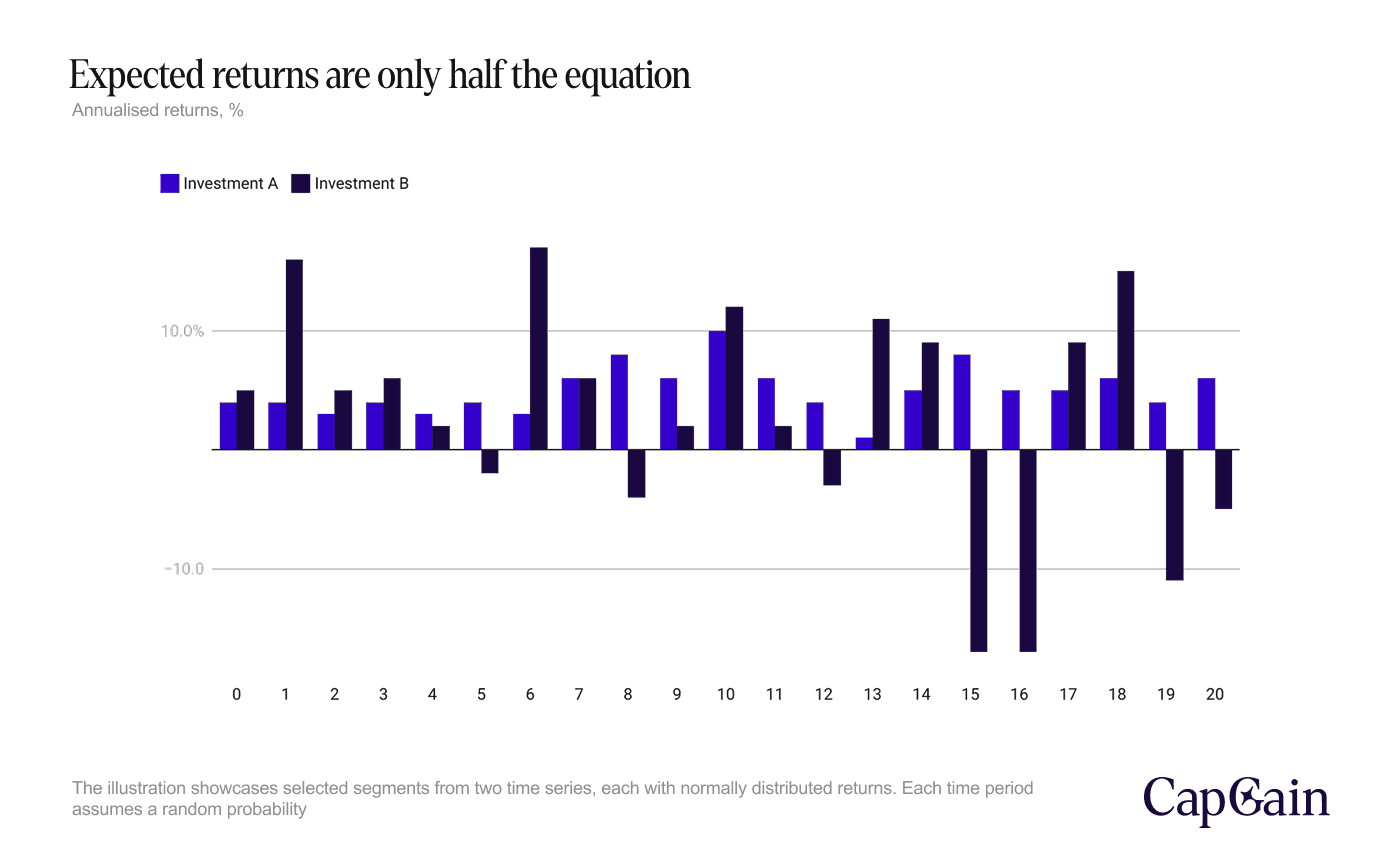
To illustrate this, consider the following numerical example with two fictitious investments.
· Investment A has an expected return (average) of 4%,
· Investment B has an expected return of 5%.
At first glance, this would suggest that Investment B is superior to Investment A.
However, with a standard deviation of 10%, Investment B is a lot more volatile than Investment A, which has a standard deviation of just 2%.
Let's examine the return over a 20-year period. It is immediately evident that Investment B's superior return is due to a few years with "unusually high" returns far exceeding the 5% average. These are offset by years with equally unusually low returns. Investment A, on the other hand, has a steadier return profile, with annual returns closer to the average.
The impact of this becomes evident when we look at the value of the two investments over time. Let's assume that we invest 100,000 in each of the two investments. At first, Investment B surpasses Investment A. The outperformance is primarily driven by just a couple of periods of outperformance for Investment B.
However, the advantage is immediately wiped out by a few periods of negative returns that lead to significant losses for Investment B. As a result, the value of Investment A - characterised by steady returns - surpasses Investment B.
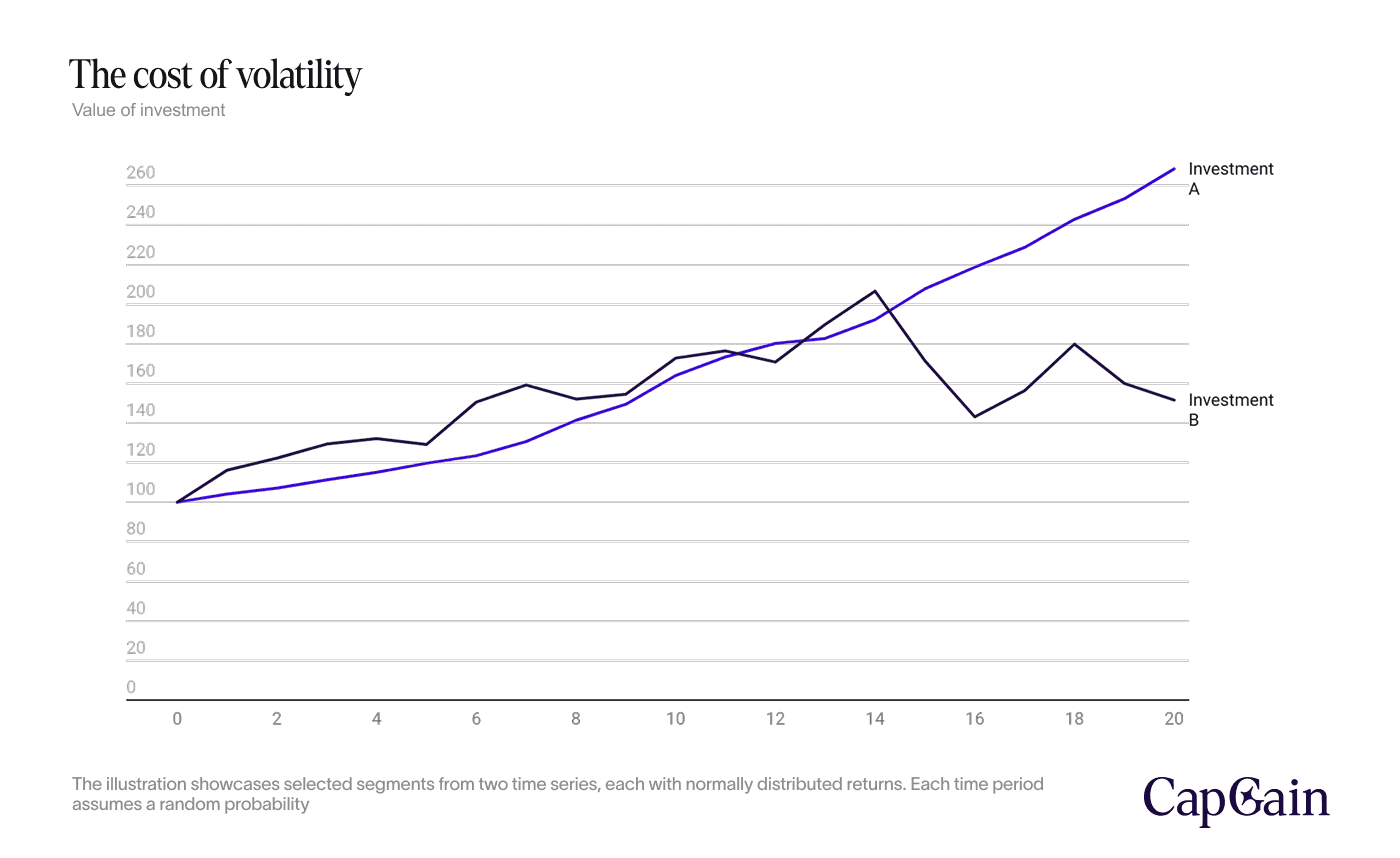
The example underscores Albert Einstein's assertion about the power of compounding. Compounding can magnify an investment's growth over time, but its efficacy is closely tied to the stability of returns. Volatile investments (like Investment B) may experience periods of rapid growth. Still, these can be severely undermined by equally significant losses.
Beyond volatility: A note on portfolio diversification
Understanding the standard deviation of individual investments enables you to select investments that align with your risk tolerance. However, if you want to invest in more than one asset, it's important to consider not only the standard deviation of each investment but also its correlation with other investments.
The significance of correlation in a diversified portfolio cannot be overstated. Investing in assets with low or negative correlation can reduce the portfolio's overall risk without sacrificing expected returns. Investing with highly correlated assets, on the other hand, can exacerbate the losses in the event of a downturn. To understand how correlation works, check out our article on {{correlation}} here.
Final thoughts
In private markets, risk and return are inseparable. Standard deviation is one of the clearest lenses through which we can assess that trade-off—but it’s not a crystal ball. It doesn’t predict outcomes; it quantifies uncertainty.
Whether you’re drawn to the high-risk, high-reward potential of venture capital or the steady predictability of private credit, the optimal risk-return profile is ultimately subjective.
There is no universal formula. Every investor must weigh their own tolerance for volatility, time horizon, and financial goals. What matters most is not chasing the highest return—but understanding the risk you're accepting in exchange for it.
Disclaimer – For Professional Clients Only
This communication is intended solely for persons classified as Professional Clients as defined by the Dubai Financial Services Authority (DFSA). It is not directed at Retail Clients and should not be relied upon by any person who does not meet the criteria for classification as a Professional Client. The information provided herein is for general informational purposes only and does not constitute, and should not be construed as, an offer, solicitation, invitation, or recommendation to buy, sell, or otherwise transact in any investment product or to engage in any investment strategy. The subject matter discussed does not relate to a DFSA-regulated financial product or service. The content is intended only to provide a general update on market conditions and does not take into account the specific investment objectives, financial situation, or particular needs of any recipient. It should not be relied upon as the basis for any investment decision. Past performance is not a reliable indicator of future performance. The value of investments and any income from them may fluctuate, and there is no assurance that the original capital will be preserved or returned. Although the information contained in this communication has been obtained from sources believed to be reliable, Arboris Capital Limited makes no representation or warranty as to its accuracy, completeness, or fitness for any particular purpose. No liability is accepted by Arboris Capital Limited, its employees, or affiliates for any direct or consequential loss arising from the use of or reliance on this material. Arboris Capital Limited is authorised and regulated by the Dubai Financial Services Authority (DFSA) and operates within the Dubai International Financial Centre (DIFC), United Arab Emirates.
Share this post


Private Equity

Sarah Hansen
July 21, 2025
•
5 min read